IBM Enterprise Extender at a Glance
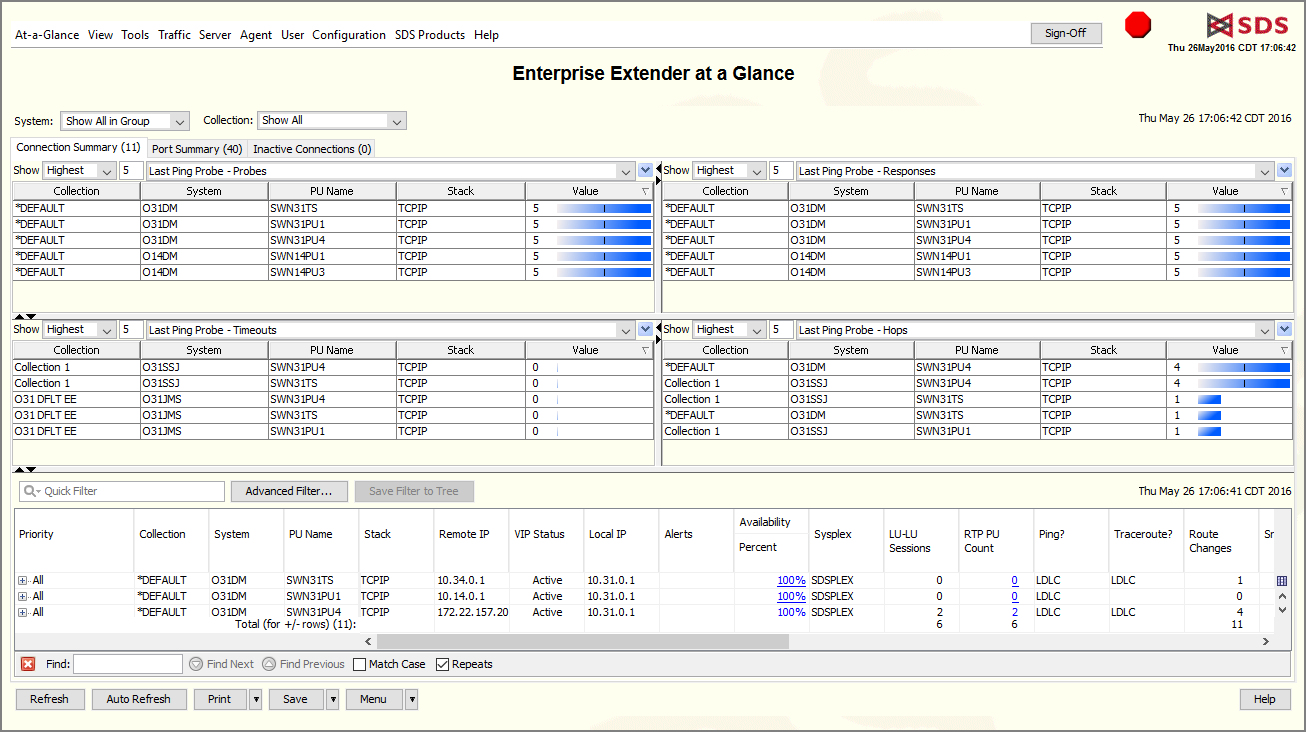
Enterprise Extender at a Glance summarizes E.E. configuration and performance in two tables:
- Connection Summary: E.E. monitoring from the VTAM side. Summaries for each E.E. instance and individual records for each class of service.
- Port Summary: E.E. monitoring from the TCP/IP side. Individual records for each class of service.
IBM Enterprise Extender Details
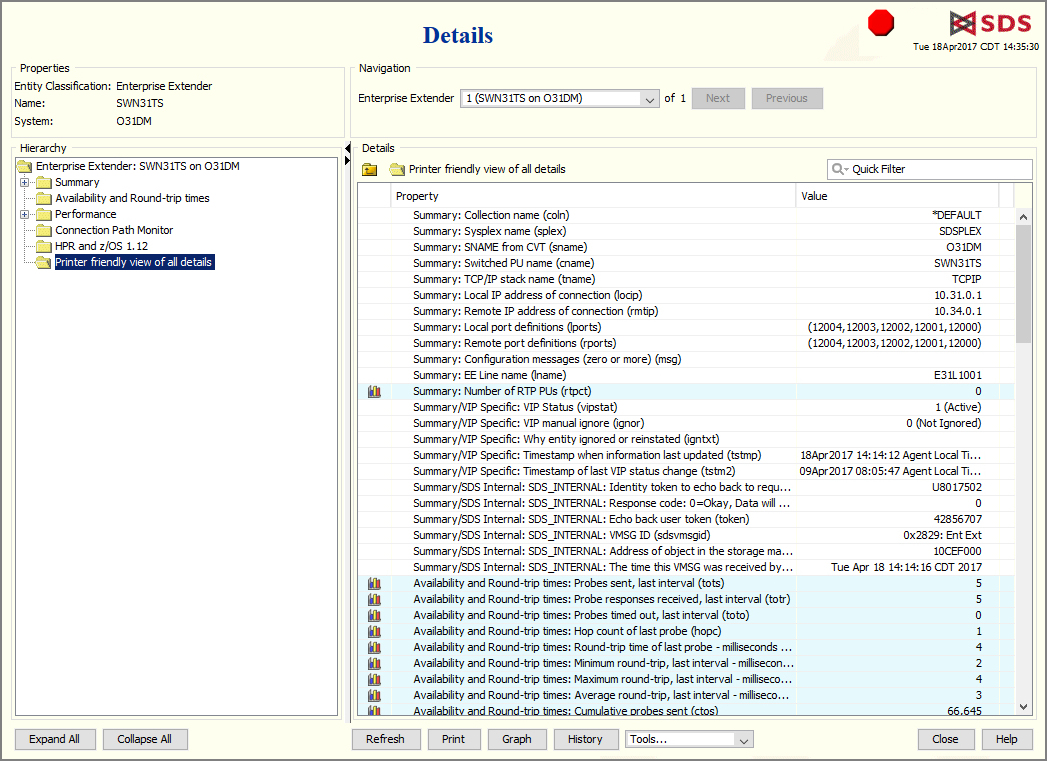
Every available detail about IBM Enterprise Extender:
- E.E. status and availability.
- Bytes, datagrams, and packets in and out.
- Hop counts and round-trip times.
- IP addresses for every node in route and alerts when route changes.
- Retry and retransmit counts.
- Counts of LU-to-LU sessions.
Enterprise Extender History
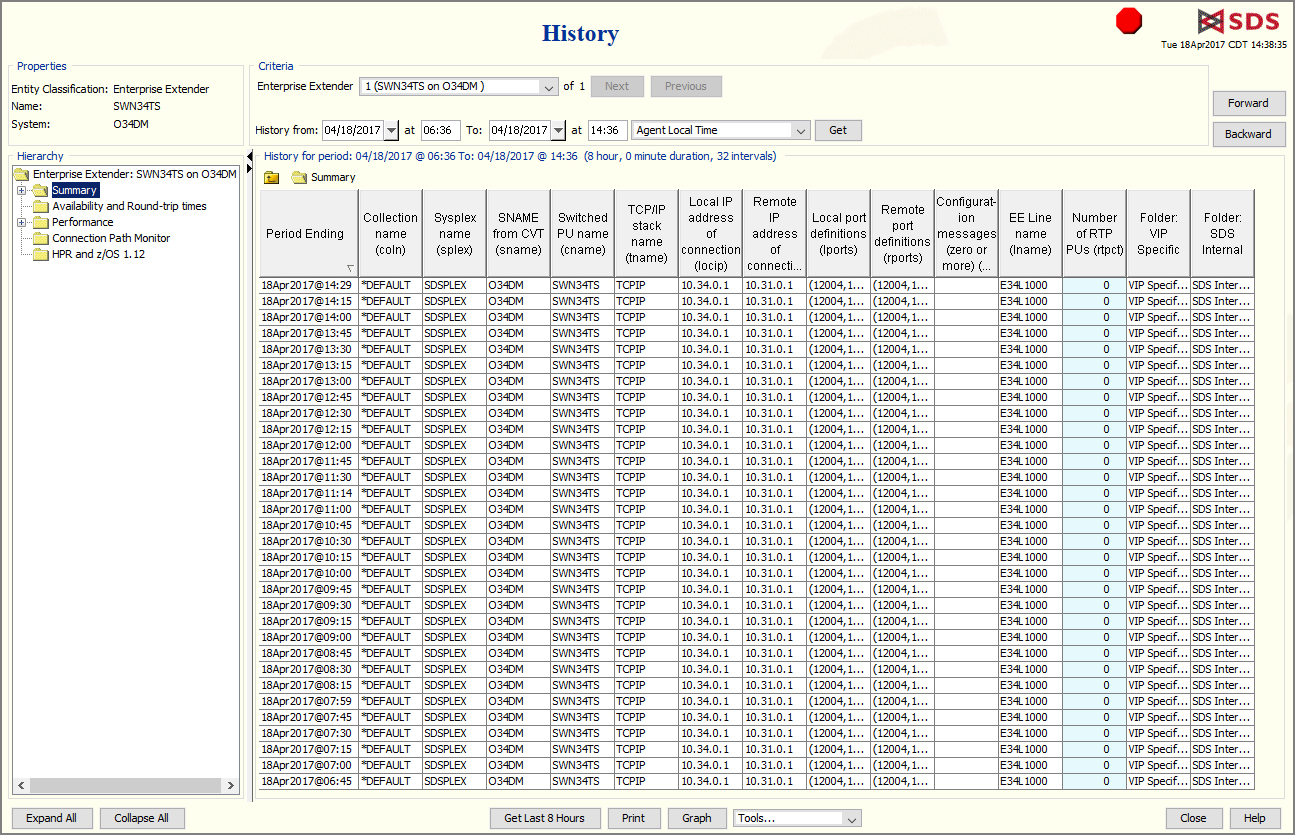
Every Enterprise Extender detail over a recent time span:
- Report spans days, weeks, months–depending on the amount of traffic and the file space that is allocated.
- Easily zero-in on specific time span, then scroll forward and back.
- Print or graph selected fields.
Enterprise Extender History Graph
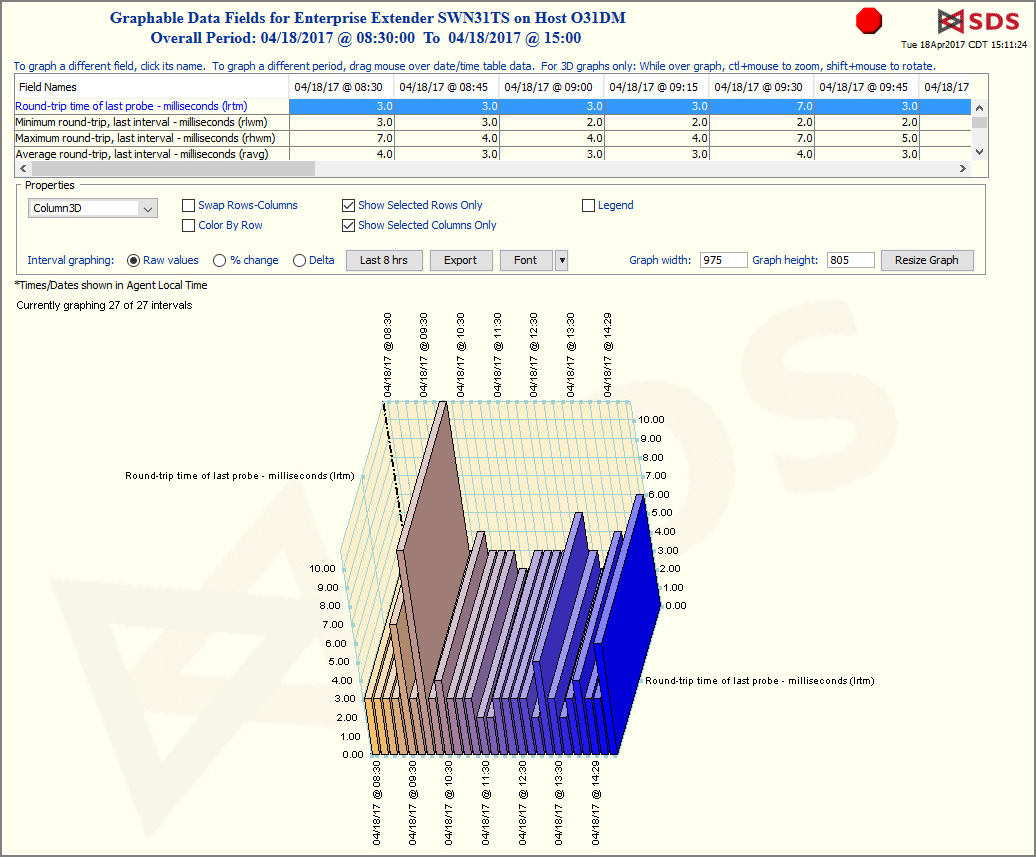
- For any of an object’s numeric fields, click and drag the mouse to select fields and times to graph.
- Select from 17 shapes of graph–lines, pies, bars, etc.
- Export raw data to comma-separated tables.
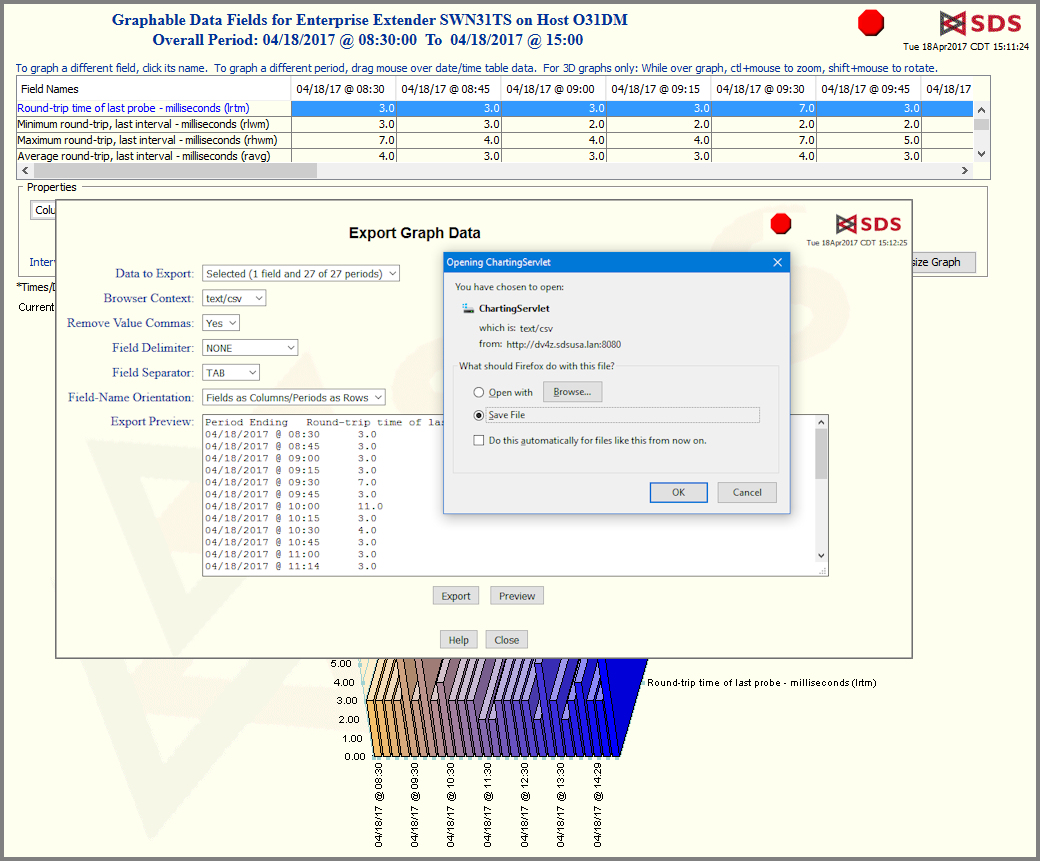
Export Enterprise Extender History
- Preview raw data.
- Save data table to local disk.
- Or open data table with another application, Excel for example.
Resources
VitalSigns for IP
View all the latest VIP resources, including webinars, datasheets, white papers, and more.
Free Demo/Trial
We offer individualized product demonstrations by request. Your organization can also try SDS Software on your system for 30 days, free of charge.


